14 interesting graphs that will tell you something new about the world (15 photos)
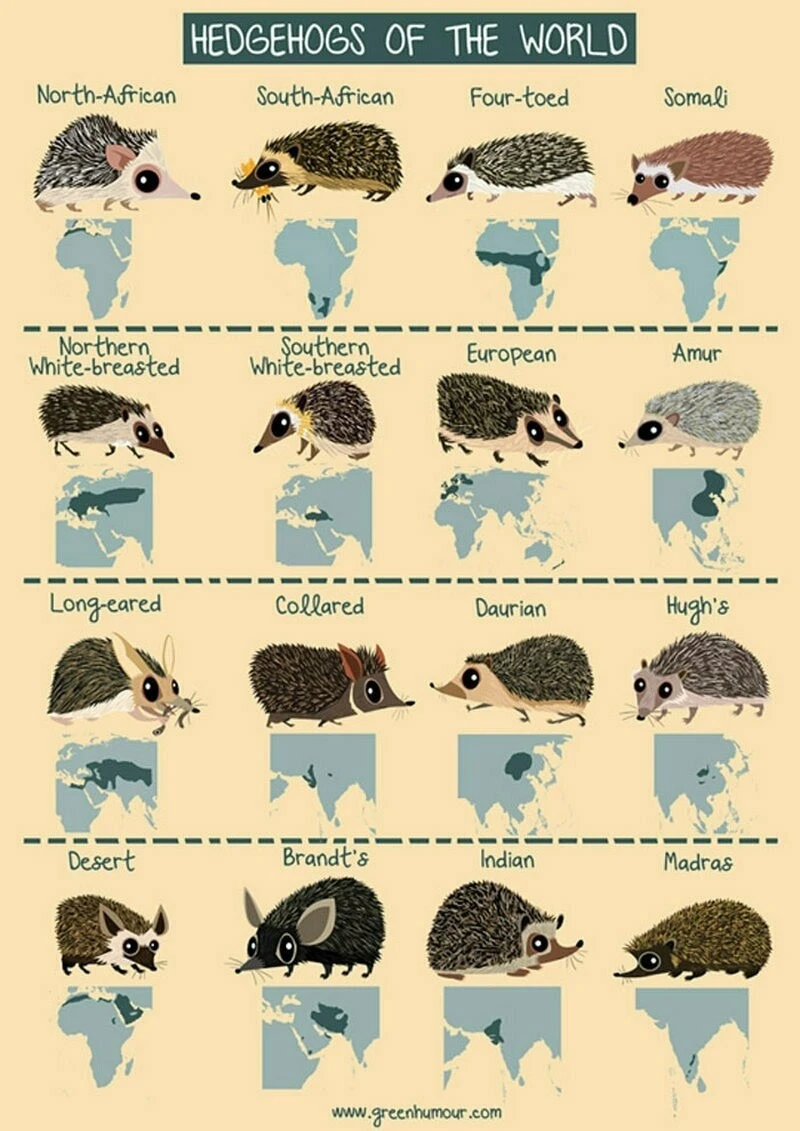
Statistics, graphs, maps - it seems that only true pedants have a love for such things. But in fact, statistics and cartography can be very fascinating. For example, did you know that the pattern on the back of giraffes varies depending on the region of Africa? Or that hedgehogs from different parts of the world look different? Maps and graphs are ideal for demonstrating how unique our world is and how different we are. 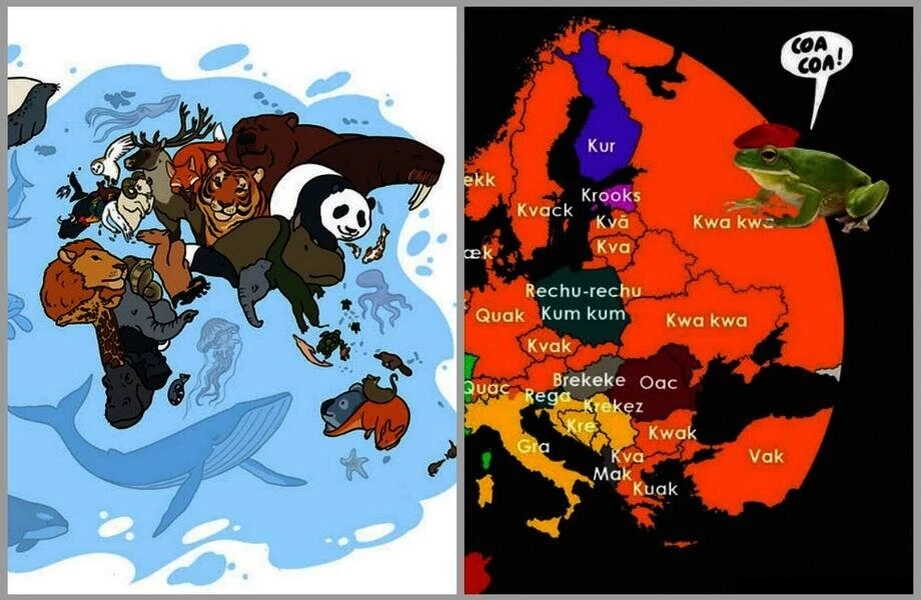
Countries where butter is more popular than olive oil are marked in yellow 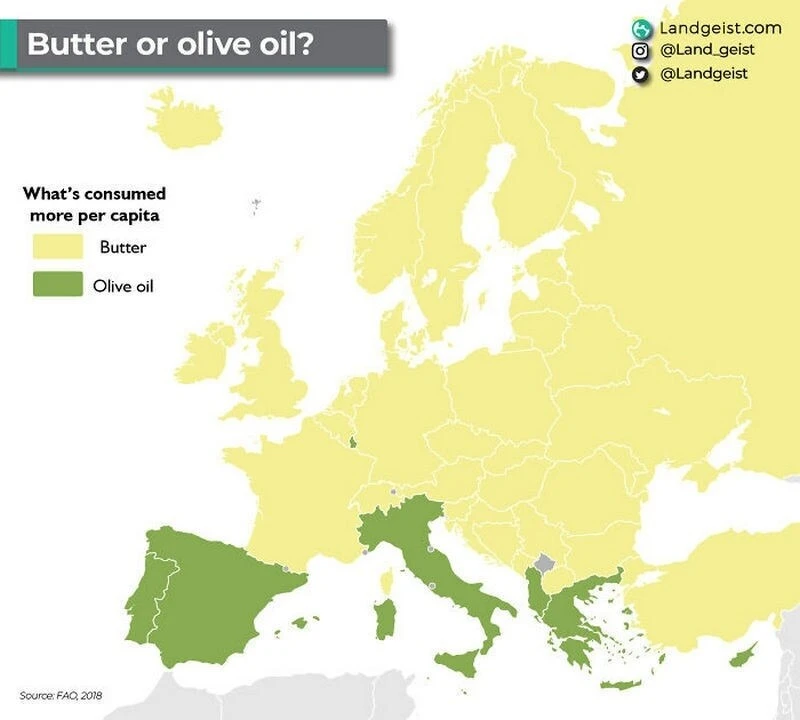
Where do they live in the wild penguins 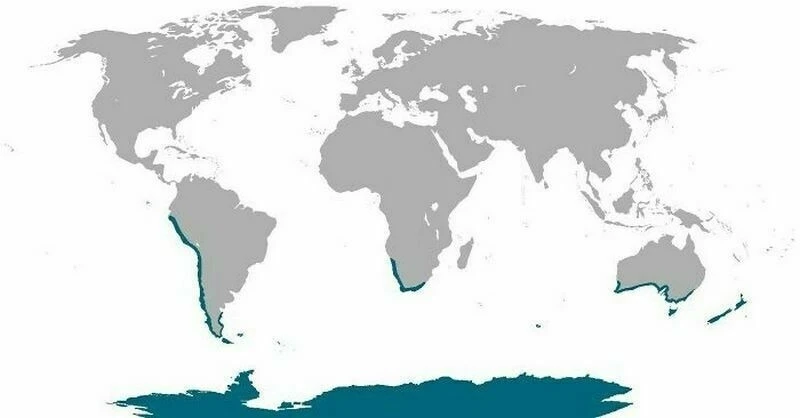
Temperature Record Map 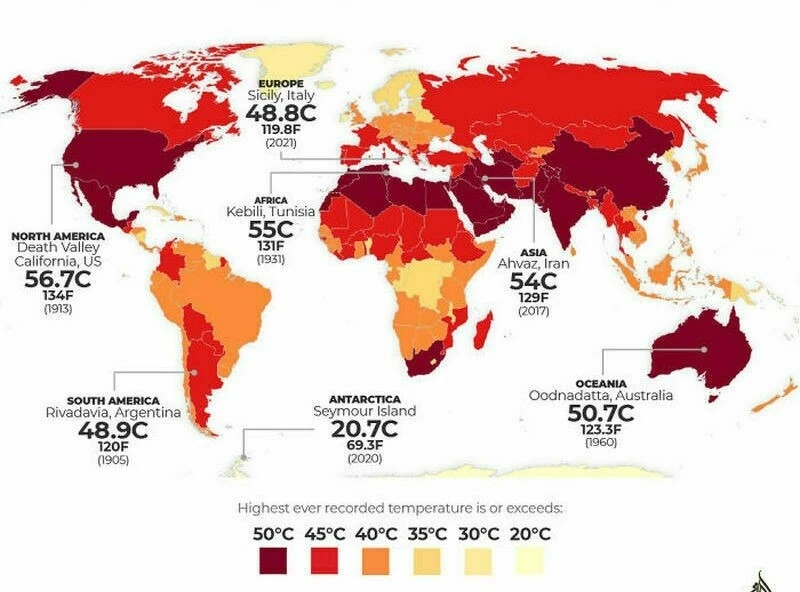
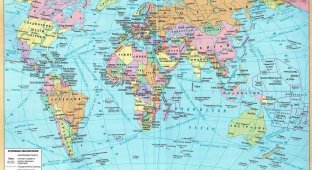
Animal Map world 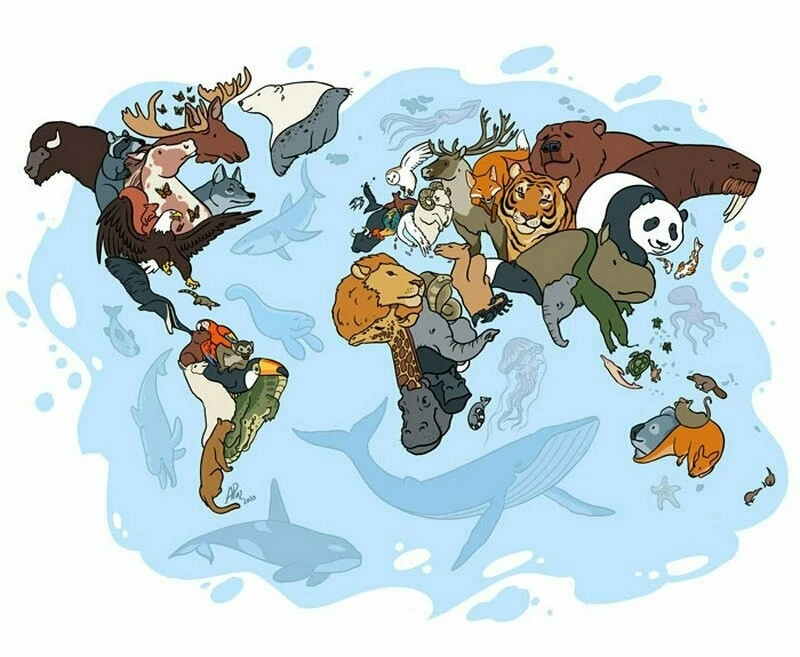
Bread from different corners of the planet 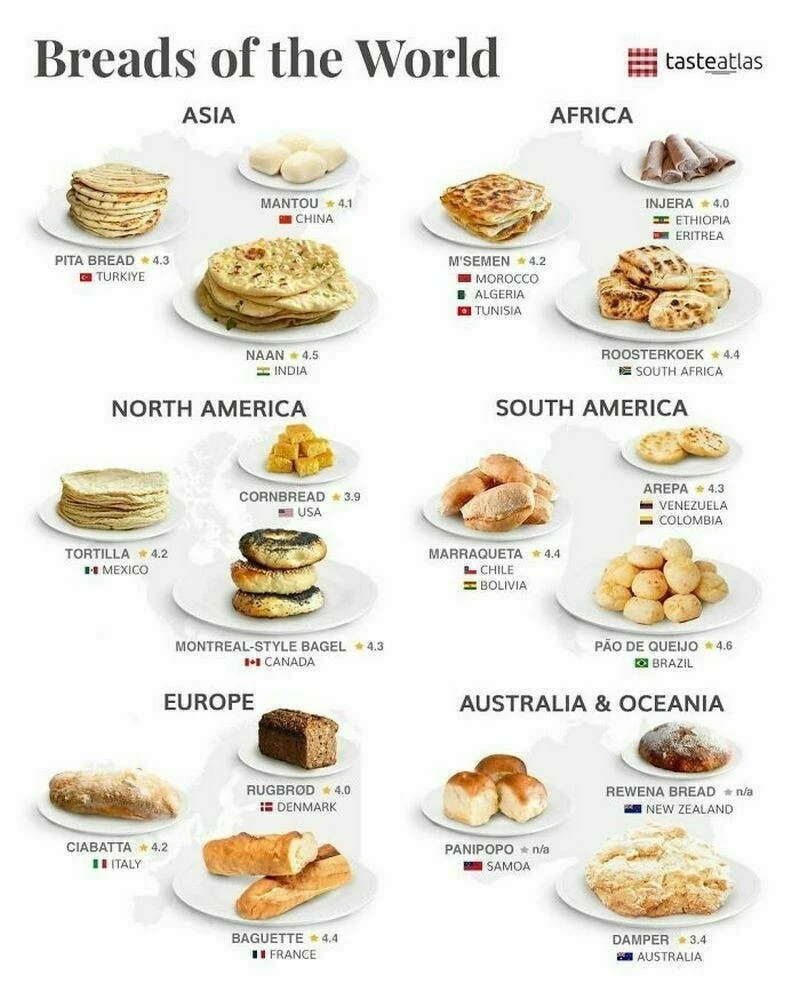
Giraffes from different regions of Africa have different patterns 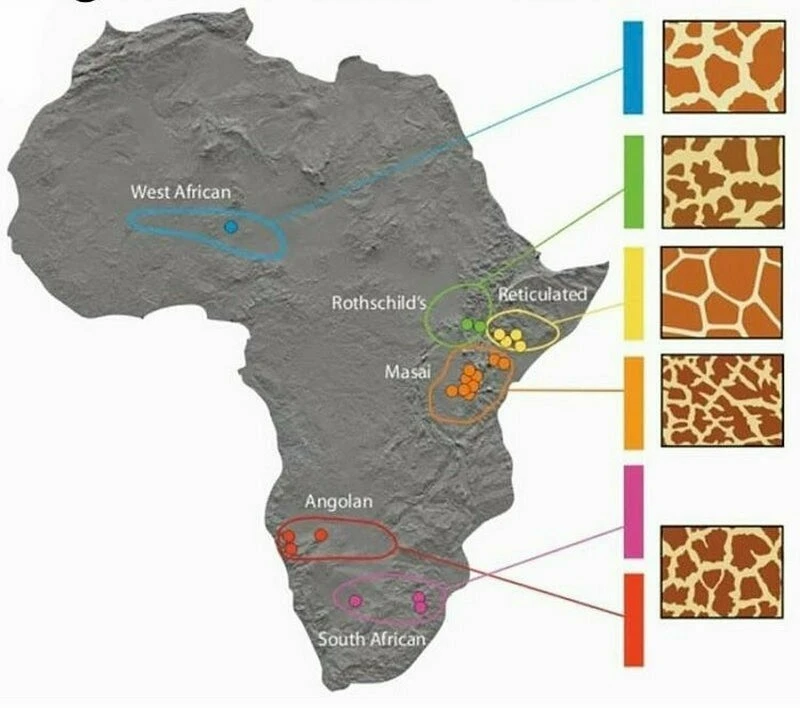
A simple counting system from different corners of the planet: counting to five everywhere, but it is different 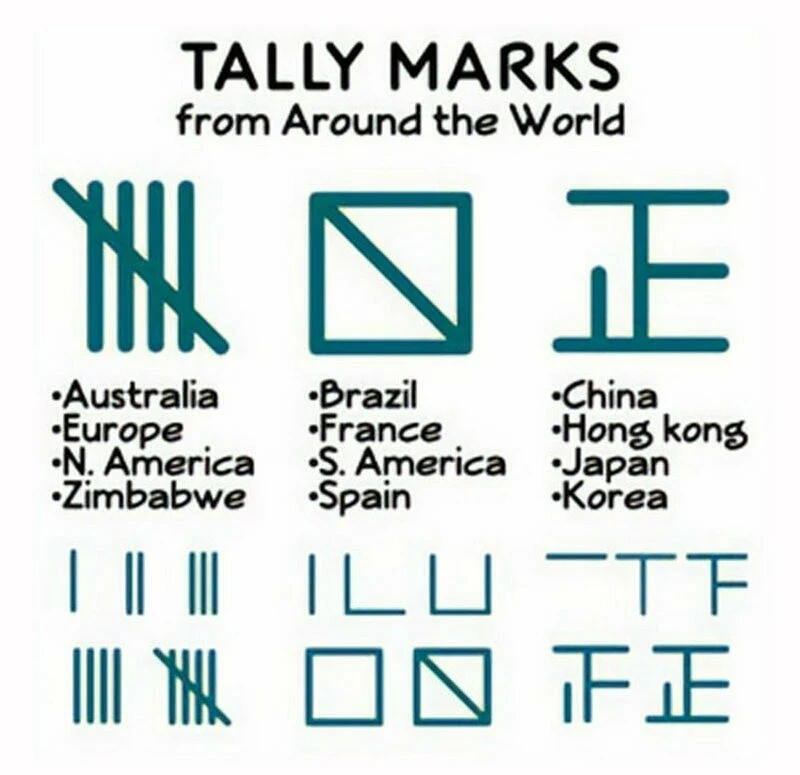
In the countries to which China delivered tea by land, the drink was called with "cha-". In the countries where China shipped tea by sea, the drink was named with "te" 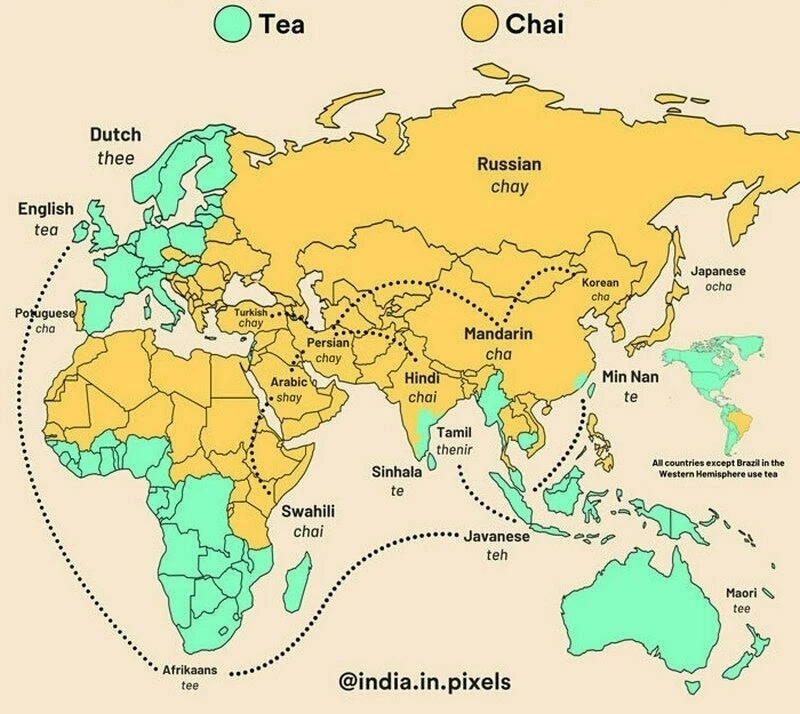
How frogs croak in European countries 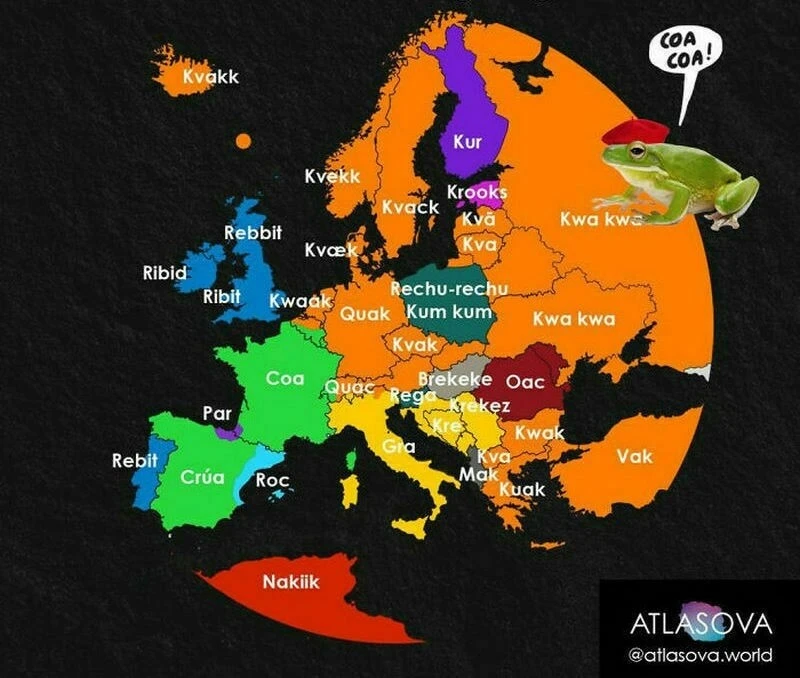
All the land areas of the planet, arranged by sizes 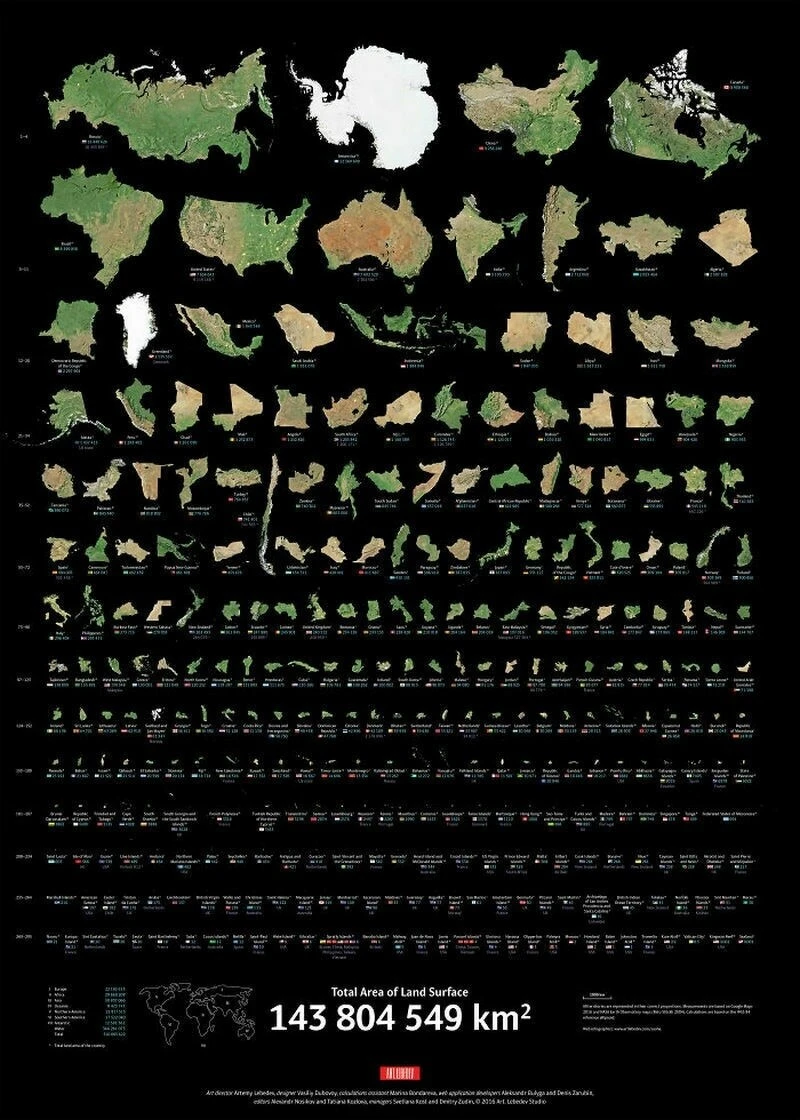
Differences in pagodas in Asia 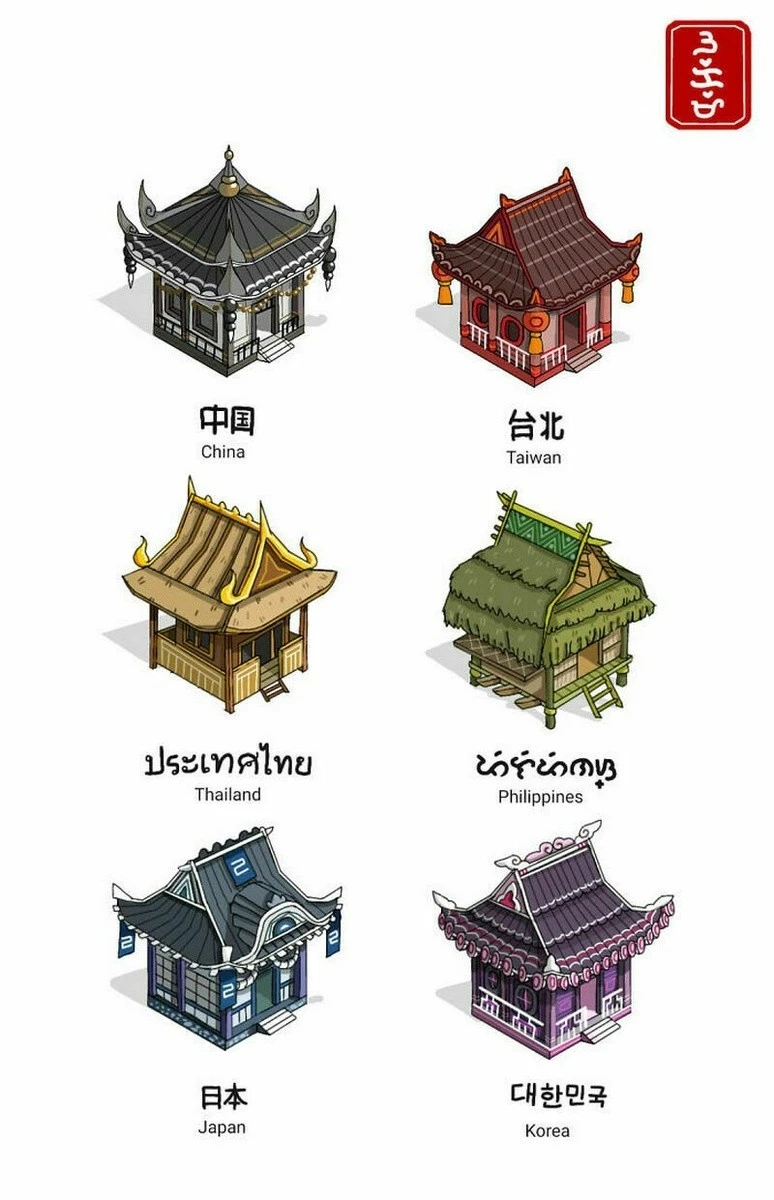
A diagram that shows who pollutes the ocean with plastic the most 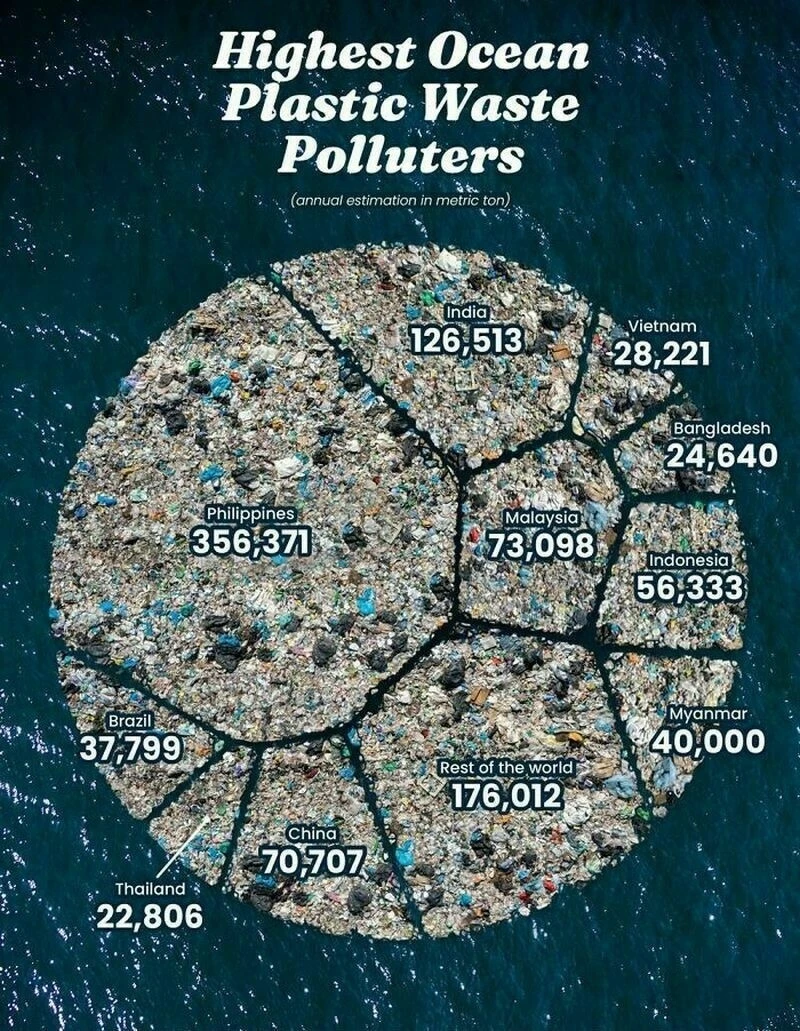
This is what sockets look like in different countries 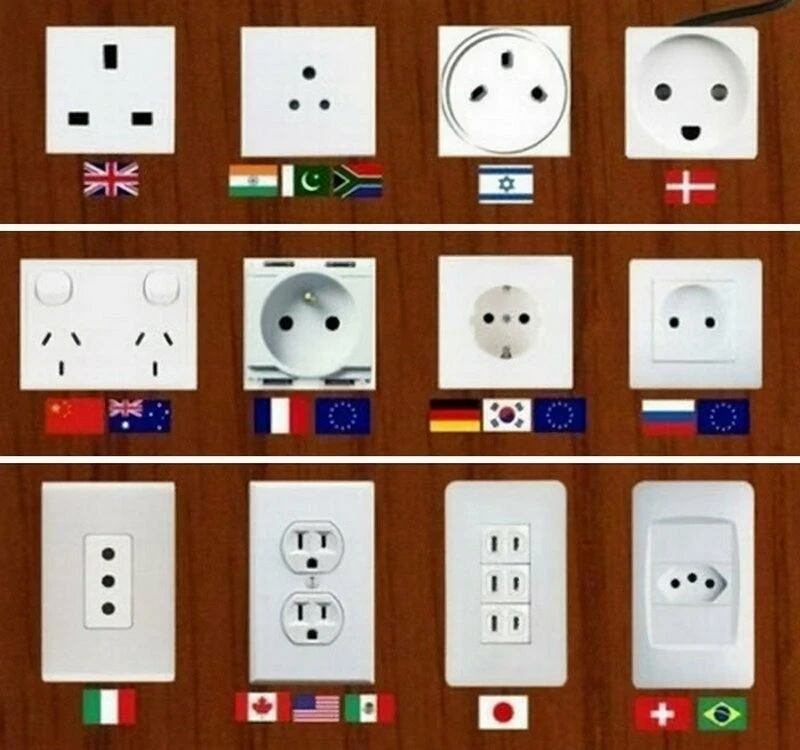
Hedgehogs of the world